This is an old revision of the document!
Table of Contents
How to Find and Assess Dangerous Vulnerabilities?
Among the research topics of the Security Group we focus on here on the following activities:
- Which vulnerable dependencies really matter?
- How to (automatically) find vulnerabilities in the deployed versions of FOSS?
- How to automatically test them (when you get a report)
- Which vulnerabilities are actually exploited in the Wild?
- Which vulnerability scanning tool performs best on your particular project?
- Empirical Validation of Vulnerability Discovery Models?
See also our sections on Security Economics and Malware Analysis.
Most importantly, Do you want data? We know that building datasets is difficult, error prone and time consuming so we have decided to share our efforts of the past 4 years. Check our Security Datasets in Trento.
Bringing order to the dependency hell: which vulnerable dependencies really matter
Vulnerable dependencies are a known problem in today’s open-source software ecosystems because FOSS libraries are highly interconnected and developers do not always update their dependencies.
In our recent paper we show how to avoid the over-inflation problem of academic and industrial approaches for reporting vulnerable dependencies in FOSS software, and therefore, satisfy the needs of industrial practice for correct allocation of development and audit resources.
To achieve this, we carefully analysed the deployed dependencies, aggregated dependencies by their projects, and distinguished halted dependencies. All this allowed us to obtain a counting method that avoids over-inflation.
To understand the industrial impact, we considered the 200 most popular FOSS Java libraries used by SAP in its own software. Our analysis included 10905 distinct GAVs (group, artifact, version) in Maven when considering all the library versions.
We found that about 20% of the dependencies affected by a known vulnerability are not deployed, and therefore, they do not represent a danger to the analyzed library because they cannot be exploited in practice. Developers of the analyzed libraries are able to fix (and actually responsible for) 82% of the deployed vulnerable dependencies. The vast majority (81%) of vulnerable dependencies may be fixed by simply updating to a new version, while 1% of the vulnerable dependencies in our sample are halted, and therefore, potentially require a costly mitigation strategy.
Our methodology allows software development companies to receive actionable information about their library dependencies, and therefore, correctly allocate costly development and audit resources, which is spent inefficiently in case of distorted measurements.
Do you want to check if your project actually uses some vulnerable dependencies? Let us know.
A Screening Test for Disclosed Vulnerabilities in FOSS Components
Our new paper in the IEEE Transactions on Software Engineering proposes an automated method to determine the code evidence for the presence of vulnerabilities in retro software versions.
Why is should you worry about a disclosed vulnerabilities? Each time a vulnerability is disclosed in a FOSS component, a software vendor using this component in an application must decide whether to update the FOSS component, patch the application itself, or just do nothing as the vulnerability is not applicable to the older version of the FOSS component used.
To address this challenge, we propose a screening test: a novel, automatic method based on thin slicing, for estimating quickly whether a given vulnerability is present in a consumed FOSS component by looking across its entire repository. We have applied it our test suit to large open source projects (e.g., Apache Tomcat, Spring Framework, Jenkins) that are routinely used by large software vendors, scanning thousands of commits and hundred thousands lines of code in a matter of minutes.
Further, we provide insights on the empirical probability that, on the above mentioned projects, a potentially vulnerable component might not actually be vulnerable after all (e.g. entries to a vulnerability database such as NVD, which says that a version is vulnerable when the code is not even there),
A previous paper in the Empirical Software Engineering Journal focussed on Chrome and Firefox (spanning 7,236 vulnerable files and approximately 9,800 vulnerabilities) on the National Vulnerability Database (NVD). We found out that the elimination of spurious vulnerability claims found by our method may change the conclusions of studies on the prevalence of foundational vulnerabilities.
If you are interested in getting the code for the analysis please let us know.
Which static analyzer performs best on a particular FOSS project?
Our paper in proceedings of International Symposium on Empirical Software Engineering and Measurement addresses the limitations of the existing static analysis security testing (SAST) tool benchmarks: lack of vulnerability realism, uncertain ground truth, and large amount of findings not related to analyzed vulnerability.
We propose Delta-Bench – a novel approach for the automatic construction of benchmarks for SAST tools based on differencing vulnerable and fixed versions in Free and Open Source (FOSS) repositories. I.e., Delta-Bench allows SAST tools to be automatically evaluated on the real-world historical vulnerabilities using only the findings that a tool produced for the analyzed vulnerability.
We applied our approach to test 7 state of the art SAST tools against 70 revisions of four major versions of Apache Tomcat spanning 62 distinct Common Vulnerabilities and Exposures (CVE) fixes and vulnerable files totalling over 100K lines of code as the source of ground truth vulnerabilities.
The most interesting finding we have - tools perform differently due to the selected benchmark.
The Delta-Bench was awarded silver medal in the ESEC/FSE 2017 Graduate Student Research Competition: Author's PDF or Publisher's Version
Let us know if you want us to select a SAST tool that suits to your needs.
Which vulnerabilities are actually exploited in the Wild?
Vulnerability exploitation is, reportedly, a major threat to system and software security. Assessing the risk represented by a vulnerability has therefore been at the center of a long debate. Eventually, the security community widely adopted the Common Vulnerability Scoring System (or CVSS in short) as the reference methodology for vulnerability risk assessment. The CVSS is used in reference vulnerability databases such as CERT and NIST's NVD, and is referenced as the standard-de-facto methodology by national and international standards and best-practices for system security (e.g. U.S. Government SCAP Protocol).
Today's baseline is that if you have a vulnerability and its CVSS score is high, you are in trouble and must fix it. But this may not be so realistic…
We are trying to assess to what degree this “baseline” can be reasonable to follow: after all, any CIO of any company big enough to care about security, will tell you “if this was a perfect world, maybe: but you are crazy if you think I'll fix every vulnerability out there, high CVSS or not”. Surely, CIOs and CEOs care about business continuity on top of business security, and to this extent updates can sometimes be more risky to apply than vulnerabilities not to patch.
 We are going to present a detailed analysis of how CVSS influences (positively and negatively) your patching policy at the beginning of August at BlackHat USA 2013 in Las Vegas, USA. Want to come? PDF of the BlackHat presentation or the talk video on YouTube . You can also check out the Full paper on ACM TISSEC (Now ACM TOPS) .
Research goals and outputs
Our research gravitates around the question “are really all (high CVSS score) vulnerabilities interesting for the attacker?” With this question we renounce in giving a general answer that would identify every possible attack vector, ending with really not identifying anything in particular (see our CCS BADGERS work): on the contrary, we are seeking for a general law of macro-security that can cover the greatest majority of the risk.
We developed a methodology that allows the organisation to:
- Identify vulnerabilities that are more likely to be exploited by attackers, and therefore represent higher risk
- Quantitatively (as opposed to current qualitative approaches) evaluate the risk of successful attacks on a per-system basis.
- Calculate the risk reduction entailed by a patching action, hence enabling the organisation to deploy meaningful vulnerability management strategies.
For example, our methodology enables CIOs and decision makers to make assessments such as “System K has a Z% likelihood of being successfully attacked. If I fix these V vulnerabilities on the system, my risk of being attacked will decrease by X%”.
Additional information on the methodology can be found in our ACM TISSEC article.
Data collection and (a quick) analysis
To perform our study we collected five databases of vulnerabilities and exploits.
- NVD is the reference database for the population of vulnerabilities (link)
- EDB is the reference database for public (proof-of-concept) exploits (link)
- EKITS is our database of vulnerabilities and exploits traded in the black markets. We have built an update infrastructure that allow us to keep our database well ahead of any public source on such vulnerabilities publicly available (e.g. Contagio's Exploit Pack Table). For more information on the black markets and our work in this area see Malware Analysis.
- SYM is our ground-truth database of vulnerabilities actually exploited in the wild as reported by Symantec's sensors world wide. This dataset is publicly available through Symantec's website.
- WINE reports volumes of attacks per month from 2009 and 2012. Its collection was possible thank to our collaboration with Symantec's WINE Program
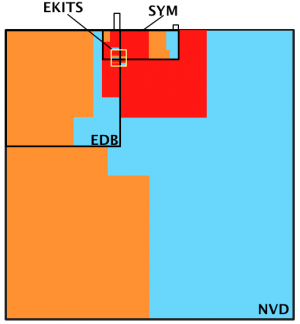
 The Picture on the right is a Venn-Diagram representation of vulnerabilities and CVSS scores in our database. Colours are representative of High, Medium and Low CVSS scores (Red, Orange and Cyan respectively). Areas are proportional to volumes of vulnerabilities. As one can immediately see, NVD is disproportionally big with respect to any other database. Remember that NVD is the database into which, according to the SCAP protocol, are contained all the vulnerabilities you should fix, and SYM is the dataset of actually exploited vulnerabilities. Adjusting by software type and year of the vulnerability does not change the overall figure: NVD is full of un-interesting (or at least not-high risk) vulnerabilities, despite what the CVSS score says.
EDB (or the equivalent OSVDB) is often used as the reference dataset for “actually exploited” vulnerabilities. Many researchers already observed that a vulnerability should represent higher risk if a public exploit for it exist. Still, EDB intersect SYM for only ~4% of its surface: most publicly available exploits aren't used by attackers! And, most interestingly, more than 75% of SYM is not covered by EDB, which decreases the credibility of the latter, as a risk marker for vulnerabilities, by a fair amount.
EKITS is the small square at the intersection between SYM and EDB. It features only about 100 vulnerabilities and still, according to Google, it may drive as much as 60% of the overall attacks against the final users ( see Trends in circumventing web-malware detection (PDF)). EKITS is covered by SYM for 80% of its surface, meaning that if a vulnerability is in the black markets it is, most likely, going to be attacked.
Focusing on the CVSS score distributions, a few facts are worth being underlined:
- Even by controlling by CVSS score in NVD, one ends up fixing way more vulnerabilities than those really used by the bad guys. Look at the all the red in the picture with respect to SYM (the vulnerabilities you should care the most about).
- EDB features mostly low and medium score vulnerabilities (and fairly easy ones too: see our technical report on vulnerabilities).
- Only 50% of SYM is composed by high risk vulnerabilities.
Overall, these results show, in our opinion, that much room for improvement in vulnerability metrics and risk assessment is possible. Our contribution is rooted in:
- Identifying technically interesting vulnerabilities for the attacker;
- Developing an expected-utility model for exploitation to plug into the assessment methodology
- Building a macro-law of security that addresses the big chunk of risk represented by only a few vulnerabilities (as it looks like from these figures and as reported by Google).
For further insights we refer the interested reader to the Malware Analysis and Security Economics sections of this Wiki.
Empirical Validation of Vulnerability Discovery Models
Vulnerability Discovery Model (VDM) operates on known vulnerability data (or observed data) to estimate the cumulative number of vulnerabilities found and reported in released software. A VDM is a function family with some parameters, for example, the linear model (LN) is: LN(t) = At + B where t is the time, A, B are two parameters. These parameters are valued by fitting the model to observed data.
A successful model should not only well fit the observed data, but also be able to predict the future trend of vulnerabilities.
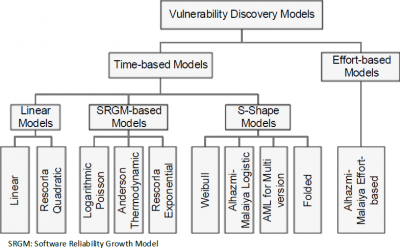
 The figure on the right exhibits the taxonomy of recent VDMs. VDMs are categorized into two major categories: time-based models and effort-based models. Most of state-of-the-art models fall into the first category. Only one model is classified into the second category. The time-based models divide into three other subcategories:
- Linear models:
- Simple Linear (LN): this is the simplest model, the straight line.
- Rescorla's Quadratic (RQ): proposed by Eric Rescorla
- Software Reliability Growth models (SRGM): models in this subcategory are fist introduced for modeling the software reliability. Now they are reused to capture the vulnerability trend.
- Anderson's Thermodynamic (AT): proposed by Ross Anderson
- Logarithmic Poisson (LP)
- Rescorla Exponential (RE): proposed by Eric Rescorla
- S-shape models: models in the category are inspired by logistic distributions. The shape of these model s is similar to letter S (s-shape).
- Alhami-Malaiya Logistic (AML): proposed by Omar Alhazmi and Yashwant Malaiya
- Weibull (JW): proposed by HyunChul Joh et al.
- AML for Multi-version software: proposed by Jinyoo Kim et al.
- Folded VDM (YF): proposed by Awad Younis et al.
The above models were supported with one or more empirical evidences by the proponents, except the Aderson's one. However, there are some concerns in their experiments:
- Vulnerability is not clearly defined while a lot of vulnerability definitions exists (from technical level to high abstract level). This would impact the way vulnerabilities were counted. This concern is referred to as vulnerability definition
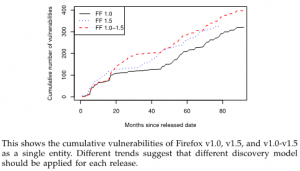
- All versions of software were often considered as a single entity. Even though there is a large amount of shared code among different versions of a software, still they are different from a non-negligible amount of code. Their vulnerability trajectories therefore are also different. This concern is referred to as multi-version software
- The goodness-of-fit (i.e. how well a model fits the observed data) was often evaluated at a single point of time. This is an internal validity to the conclusion of previous experiments. This concern is referred to as brittle goodness-of-fit.
The proposed solution
We propose an experimental methodology to systematically assess the performance of a model based on two quantitative metrics: quality and predictability. The methodology includes following steps:
Step 1Acquire the data sets: collect different data sets of vulnerabilities with respect to different definitions of vulnerability and different versions of software. The assessment of VDM will be established based on these data sets, so it will cover different definitions of vulnerability. By doing this, we address the vulnerability definition and multi-version software concerns.Step 2Fit the VDM on collected data: estimate the parameters of VDM so that it could fit the collected data as much as possible. The goodness-of-fit of the fitted model can be evaluated by using the chi-square test for goodness-of-fit.Step 3Perform goodness-of-fit quality analysis: perform an analysis on the quality of VDM in software lifetime. This addresses the brittle goodness-of-fit concern.Step 4Perform predictability analysis: perform an analysis on the predictability of VDM.Step 5Compare VDM: compare a VDM with others to determine which one is better.
We apply the proposed methodology to evaluate state-of-the-art models. They are evaluated in different usage scenarios such as:
- Plan for lifetime support: we have the history data for a year (or more). We are looking for what will happen in the next quarter to plan the support activities.
- Upgrade or keep: we have the history data for a year. We want to know the trend in next 6 months so that we can decide whether to keep current system or to go over the hassle of updating.
- Long-term deployment in the field: we have the history data for a year (or more). We would like to decide whether to deploy the system in the field. Hence we want to see the situation in the next one or two years. For example, an operating system and a browser used in a ticketing machine at a station. Such system might be there for years.
Our analysis has revealed that the most appropriate model is the simplest one (LN) when software is young (12 months). In other cases, s-shape models perform better where AML model is significantly better for middle-age software (36 months), but there is no statistically significant difference among s-shape models when software is old (72 months).
The details of our methodology as well as the validation of existing models are published in TSE. Preliminary analysis on VDM could be found in our ESSoS'12, and ASIACCS'12 papers
People
The following is a list of people that have been involved in the project at some point in time.
- Viet Hung Nguyen
- Stephan Neuhaus
Projects
This activity was supported by a number of project
Publications
- I. Pashchenko, S. Dashevskyi, F. Massacci. Delta-Bench: Differential Benchmark for Static Analysis Security Testing Tools. To appear in International Symposium on Empirical Software Engineering and Measurement (ESEM2017), 2017. Prepub version
- I. Pashchenko. FOSS Version Differentiation as a Benchmark for Static Analysis Security Testing Tools. In Proceedings of 2017 11th Joint Meeting of the European Software Engineering Conference and the ACM SIGSOFT Symposium on the Foundations of Software Engineering (ESEC/FSE’17), 2017. Author's PDF or Publisher's Version
- V.H. Nguyen, S. Dashevskyi, and F. Massacci. An Automatic Method for Assessing the Versions Affected by a Vulnerability, Empirical Software Engineering Journal. 21(6):2268-2297, 2016. Publisher's copy
- L. Allodi. The Heavy Tails of Vulnerability Exploitation In the Proceedings of ESSoS 2015 PDF.
- L. Allodi, F. Massacci. The Work-Averse Attacker Model. In the Proceedings of the 23rd European Conference on Information Systems (2015). PDF.
- L. Allodi, F. Massacci. Comparing vulnerability severity and exploits using case-control studies. In ACM Transactions on Information and System Security (TISSEC).PDF (Draft)
- S. Dashevskyi, D.R. dos Santos, F. Massacci, and A. Sabetta. TestREx: a Testbed for Repeatable Exploits, In Proceedings of the 7th USENIX conference on Cyber Security Experimentation and Test (CSET), 2014. PDF
- F. Massacci, V.H. Nguyen. An Empirical Methodology to Evaluate Vulnerability Discovery Models. In IEEE Transactions on Software Engineering (TSE), 40(12):1147-1162, 2014.PDF
- L. Allodi. Internet-scale vulnerability risk assessment (Extended Abstract). In Proceedings of Usenix Security LEET 2013, Washington D.C., USA. PDF
- Luca Allodi, Fabio Massacci How CVSS is DOSsing your patching policy (and wasting your money). Presentation at BlackHat USA 2013. Las Vegas, Nevada, Jul 2013. Slides White Paper
- L. Allodi, W. Shim, F.Massacci. Quantitative assessment of risk reduction with cybercrime black market monitoring. In: Proceedings of the 2013 IEEE S&P International Workshop on Cyber Crime (IWCC'13), May 19-24, 2013, San Francisco, USA. PDF
- V.H.Nguyen and F.Massacci. The (Un)Reliability of Vulnerable Version Data of NVD: an Empirical Experiment on Chrome Vulnerabilities. In: Proceeding of the 8th ACM Symposium on Information, Computer and Communications Security (ASIACCS)'13, May 7-10, 2013, Hangzhou, China PDF.
- V.H.Nguyen and F.Massacci. An Independent Validation of Vulnerability Discovery Models. In: Proceeding of the 7th ACM Symposium on Information, Computer and Communications Security (ASIACCS)'12, May 2-4, 2012, Seoul, Korean. PDF
- V.H.Nguyen and F.Massacci. An Idea of an Independent Validation of Vulnerability Discovery Models. In: Proceeding of the International Symposium on Engineering Secure Software and Systems (ESSoS)'12, February 16-17, 2012, Eindhoven, The Netherlands. PDF (Short paper).
- F. Massacci, S. Neuhaus, V. H. Nguyen. After-Life Vulnerabilities: A Study on Firefox Evolution, its Vulnerabilities, and Fixes. Proc. of ESSOS-2010. PDF
Talks and Tutorials
- Ivan Pashchenko, Stanislav Dashevskyi, Fabio Massacci Delta–Bench: Differential Benchmark for Security Testing. Poster at ESSoS 2017. Bonn, Germany, July 2017. Poster
- Ivan Pashchenko, Stanislav Dashevskyi, Fabio Massacci Design of a benchmark for static analysis security testing tools. Presentation at ESSoS Doctoral Symposium 2016. London, UK, Apr 2016. Slides
- Luca Allodi Internet-scale vulnerability risk assessment (Extended Abstract). Presentation at Usenix Security LEET 2013. Washington D.C., USA, Aug 2013. Slides
- Luca Allodi. Quantitative assessment of risk reduction with cybercrime black market monitoring. Talk at IEEE SS&P IWCC 2013, San Francisco, CA, USA. Slides
- Luca Allodi Exploitation in the wild: what do attackers do, and what should(n’t) we care about. UniRoma Tor Vergata. February 2013. Slides
- Luca Allodi. A Preliminary Analysis of Vulnerability Scores for Attacks in Wild. Presentation at 2012 CCS BADGERS Workshop, Raleigh North Carolina (U.S), 15 Oct 2012 Slides
- Fabio Massacci. My software has a vulnerability, should I worry? Siemens Research Center, Munich. 18th December 2012. slides. See also Security Economics and Vulnerability Discover Models
- Viet Hung Nguyen. The (Un)Reliability of NVD Vulnerable Version Data An Empirical Experiment on Google Chrome Vulnerabilities Presentation at ASIACCS'13, May 203, Hangzhou, China. Slides
- Viet Hung Nguyen. Vulnerability Discovery Models: Which workds, which doesn't? Presentation at ASIACCS'12, 3rd May 2012, Seoul, Korea Slides (Revised and updated version of the ESSoS'12 slides)
- Viet Hung Nguyen. Vulnerability Discovery Models: Which workds, which doesn't? Presentation at ESSoS'12, 17th February 2012, Eindhoven, The Netherlands Slides


